______________________
______________________
Click on Any Screenshot to Scroll through Quickly
Commentary is opinion only and should not be considered specific investment advice. Futures trading contains substantial risk and is not suitable for every investor. See Hypothetical Disclaimer on this website.
Nothing worse than being in the middle of the middle of the range.

Novemer 22, 2019 (Crude)
Parabolic moves and nice Down & Ups. Crude is trading like the days of old lately.


November 8, 2019 (NQ)
Oh boy, new indicators for Christmas.

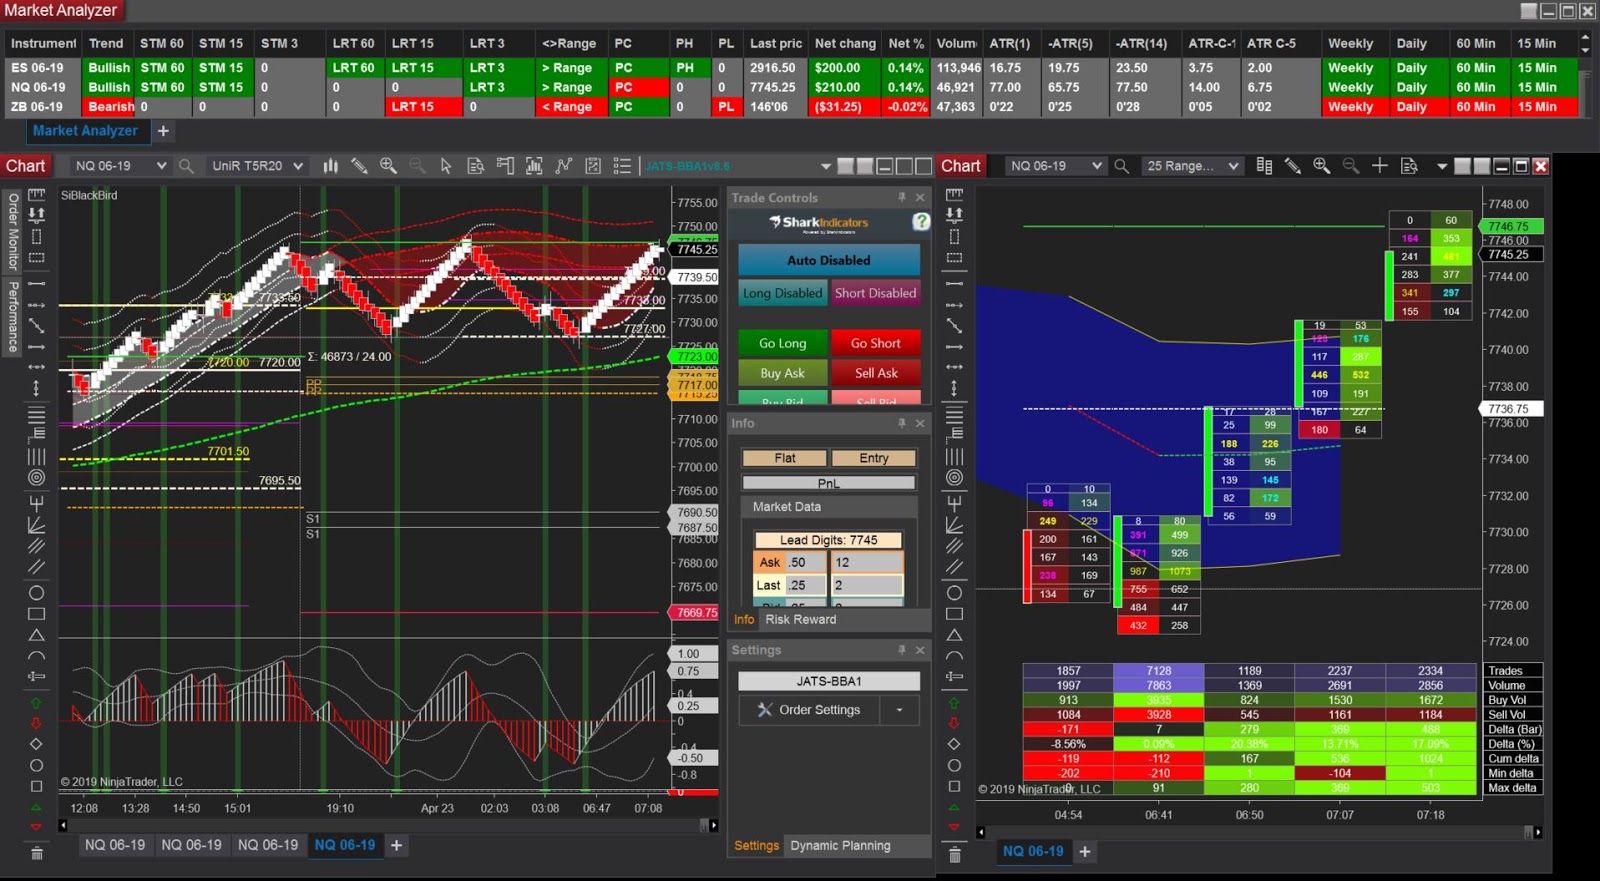
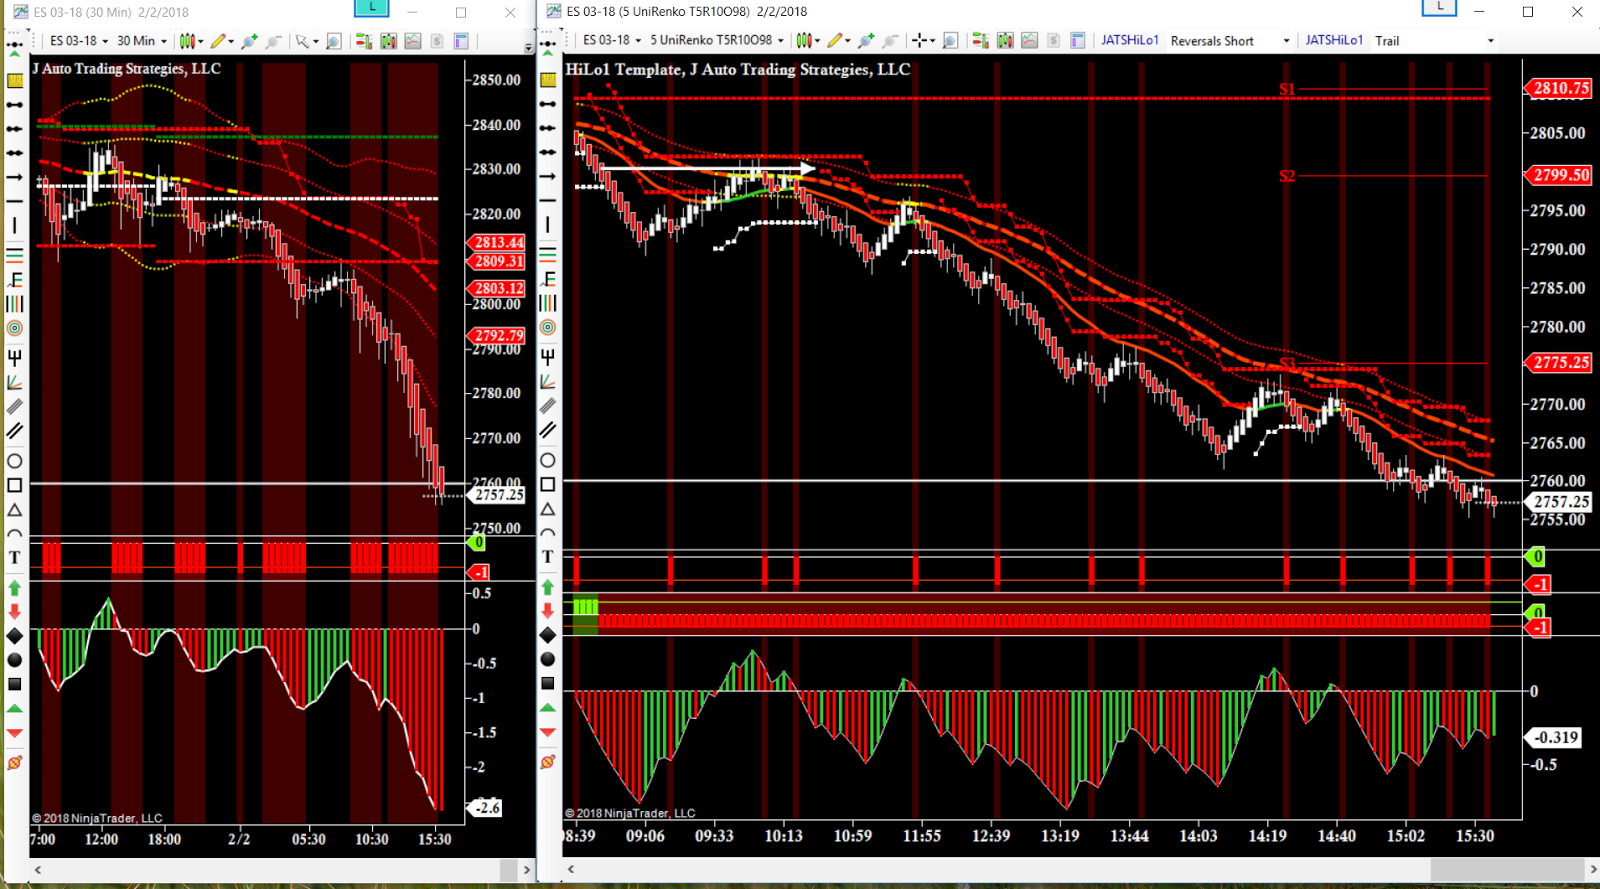
Anyone like to fade high volatility from outside a range back inside the range? Friday offered the perfect high volatility fade. Notice the flat range, then volatility pickup, and then the reversal at the outer linear regression bands with the range contracting, not expanding (expansion would signal trend continuation)? Signature equity index move.


I have added 2 profit targets & risk amounts during morning session on the market analyzer. Now have something to trade to and know how much risk to use. Awesome!!!!

Emini S&P 500 pulls back to triggers and resumes trend. If it breaks the red or green trigger, look for a deeper pullback or change in direction. Always look at the trend filter. Indicator on bottom shows how far price is away from trend line. #es_f #template

June 4, 2019 - #CL - Premarket. Lather, rinse, repeat IF price breaks below Globex range? Not so fast. The main linear regression white trend line (LR 1) is sitting right there at 51.50. This time price won't get that far. Probably a nice upside surprise in store for today.

MAY 25, 2019 - MAY 25, 2019 - #JATSBBA1-Crude Template on 5 Min chart. JATSOpeningRange Indicator and JATSLRTLines Indicator for NT8. Price trading outside 30 Min Opening Range.


MARCH 29 - #6B. Brexit day.


January 3 - #NQ - Systematic Trade Logic: 4/1 Crossovers to Level 4.

 |
| JATS Custom Algo 1 |


November 20 - JATSLRTLines answers the question, "When is it good to curve fit?" Answer: When you are fitting volatility.


November 9, 2018. #CL - Balls & Strikes, 1's & 2's & 3's, means 1 ATR, 2 ATR & 3 ATR, don't have to swing for the fences (4's & 5's) to make a good living trading. Just 1's, 2's & 3's. All the time. Easy. Right?


Rainman said yesterday: "Traders never study for the one off days like today. Fair enough since they don't happen enough, but you have seen them before. Find your trigger on days like today that cause fading and turn the trigger into $$ next time. look from the outside and you will see." My Answer to Rainman: "Use a 15 minute anchor for trade setups. I set my Mom up like an oscillator, so I can see it when it is rising and falling. So I have linear regression and momentum for trend and direction, and set the ATR offset multiplier up for breakouts. After the breakout, then I can add more ATRs for profit targets or stop losses. See it? Get it?"
 |
| Set Offset Multiplier for Breakouts on 15 Min Chart |
 |
| Add additional Offset Multipliers for Profit Targets or Stop Losses |


September 27 - Premarket - Nat Gas on the move.


September 11 - (Remembering Benghazi and 9/11) Mid-Day Update: #NQ - JOLTS Job Report for August 2018: 6.969 Job Vacancies Need Immediate Filling (within 30 days). Best Jobs # in DECADES!!!!! Market turned around and late morning Rally into R2.


August 24 - Nat Gas - Market pulled back Friday. Some great setups on the 5 Minute Chart with JATSHiLo1 BloodHound Template. Chart Template is NT8.


August 3 - Premarket - Ready to Trade NFP in 3 minutes! JATSLRTBands Template.

July 25 - Crude - Whirlybird 5 minute price action, drawdown rally up, reversal, V bottom 2nd rally up.


Developing Consistency, building a solid foundation to allow for proper sizing when core conditions setup.
Event Condition Triggers. Is there a news event, trending condition, or possible fundamental change in economic conditions?
Trading Routine. Following a daily process and controlling risk. Whether to take signals discretionary, automated, or a hybrid trading in and out. Coming up with ideas. Using filters to alert signals.
Deciding whether or not to become a $Million Trader within the next 12-24 months.
Filtering for the best setups.


June 27 - CL - rally off of a 10M+ barrel draw on EIA inventory report. Tanker Trackers asking, what? where? when? LOL.


June 7 - New JATS-LRTBandsv3.1 in Development!

 |
| JATSLRTBands BloodHound Template |
June 5 - Markets popped on JOLTS Report - 6.79 Million Jobs Available! But then the markets flattened out right after! :(. Too much trade tariff jawboning going on.


May 29 - Equities Sell Off on Concerns Italy Unable to Form New Government


May 11 - Emini S&P 500 & Nasdaq - Premarket (5:50 am CDT)
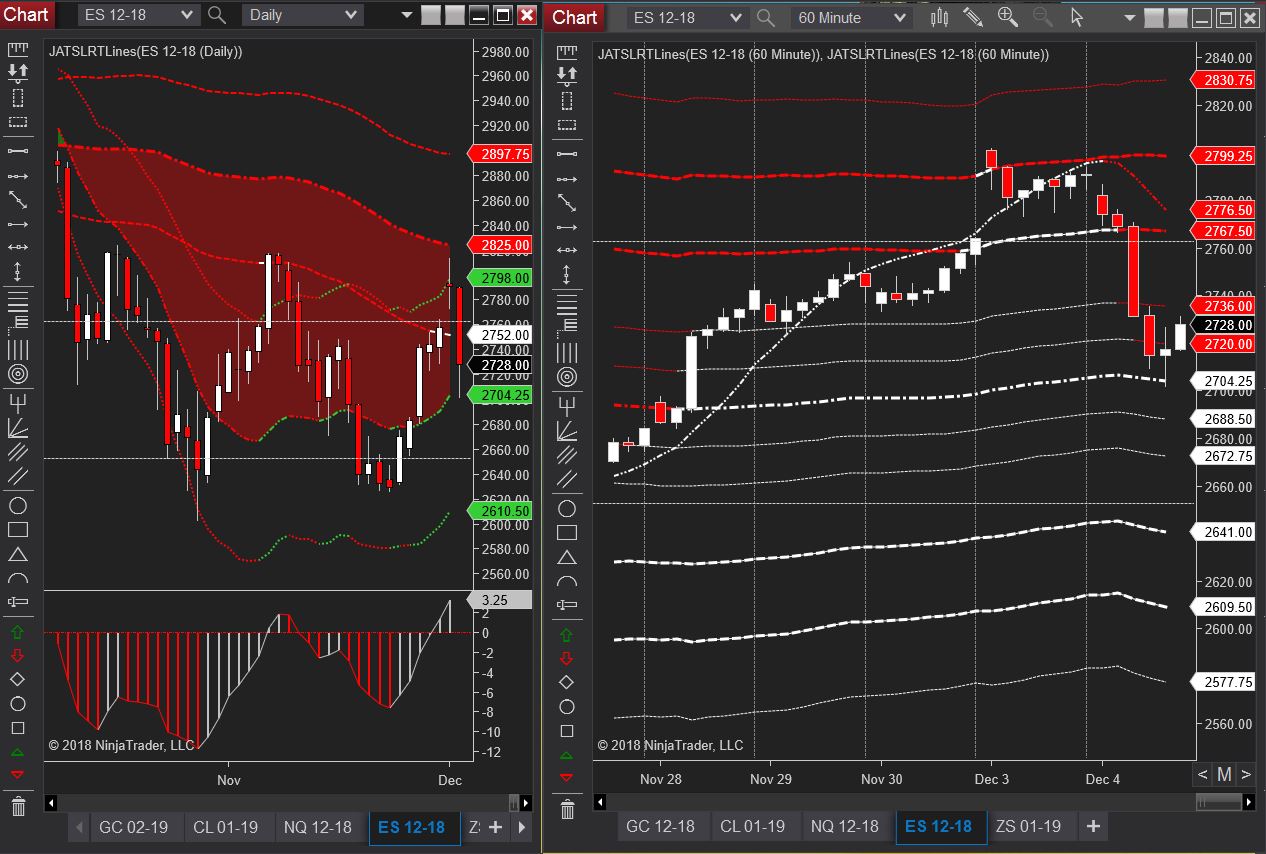
The NQ hit its March 16-19 weekend GAP lines yesterday, but just now got a toe above the line. Looks like ES may not get up to its same GAP lines from that weekend. If ES fails - it is sell May and go away. NQ strength is 100% Buffet's Apple buy. Need Warren to buy some more today would be good to get us over these lines.


See the 60 minute chart. The SuperTrend band has been broken and we are heading long.


April 30 - Nasdaq - Trade the Signal - Not the Noise

April 25 - Nasdaq - Waiting for Daily Head & Shoulders to Break.
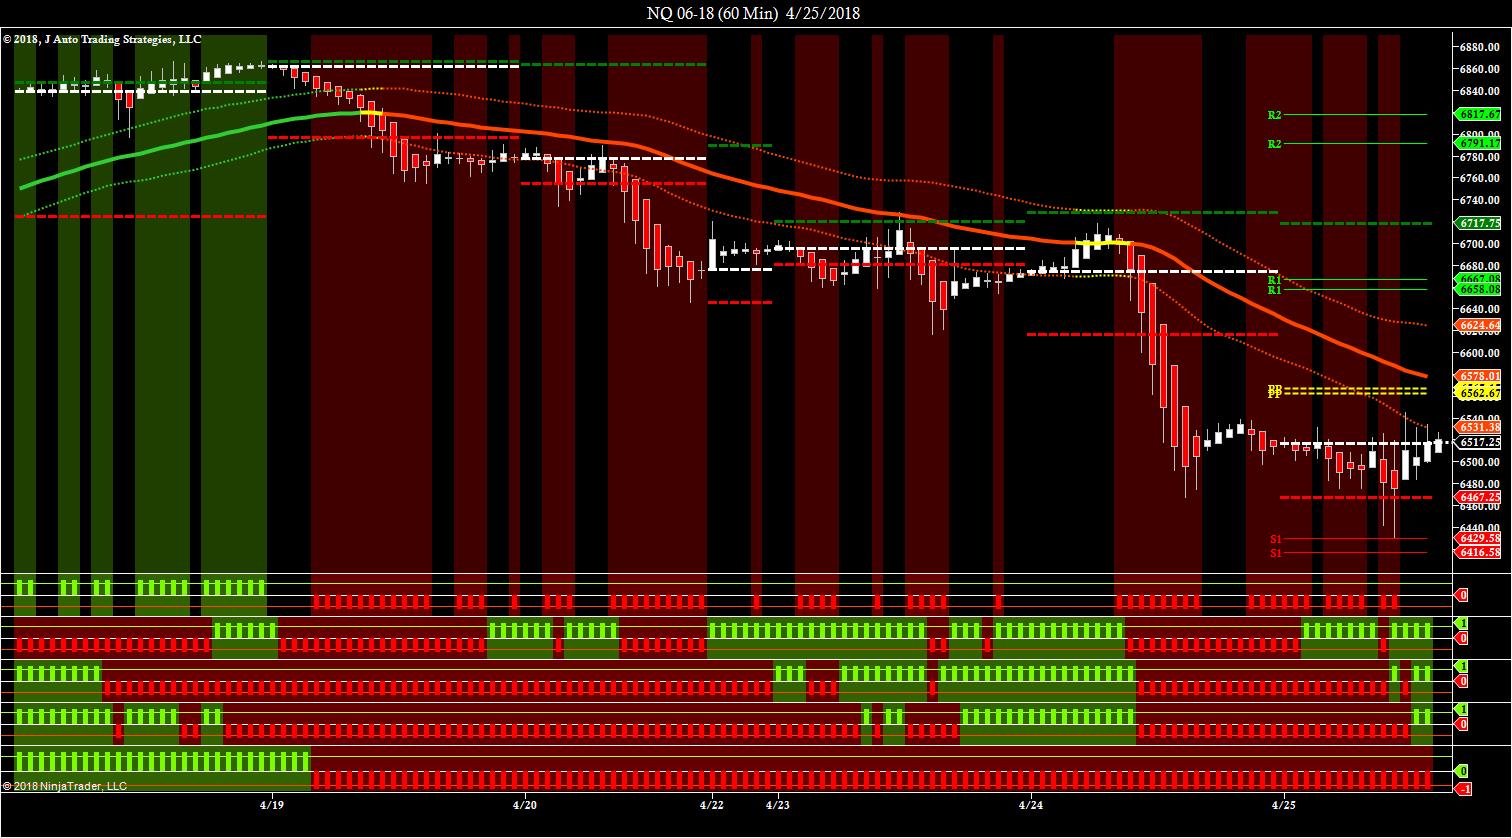


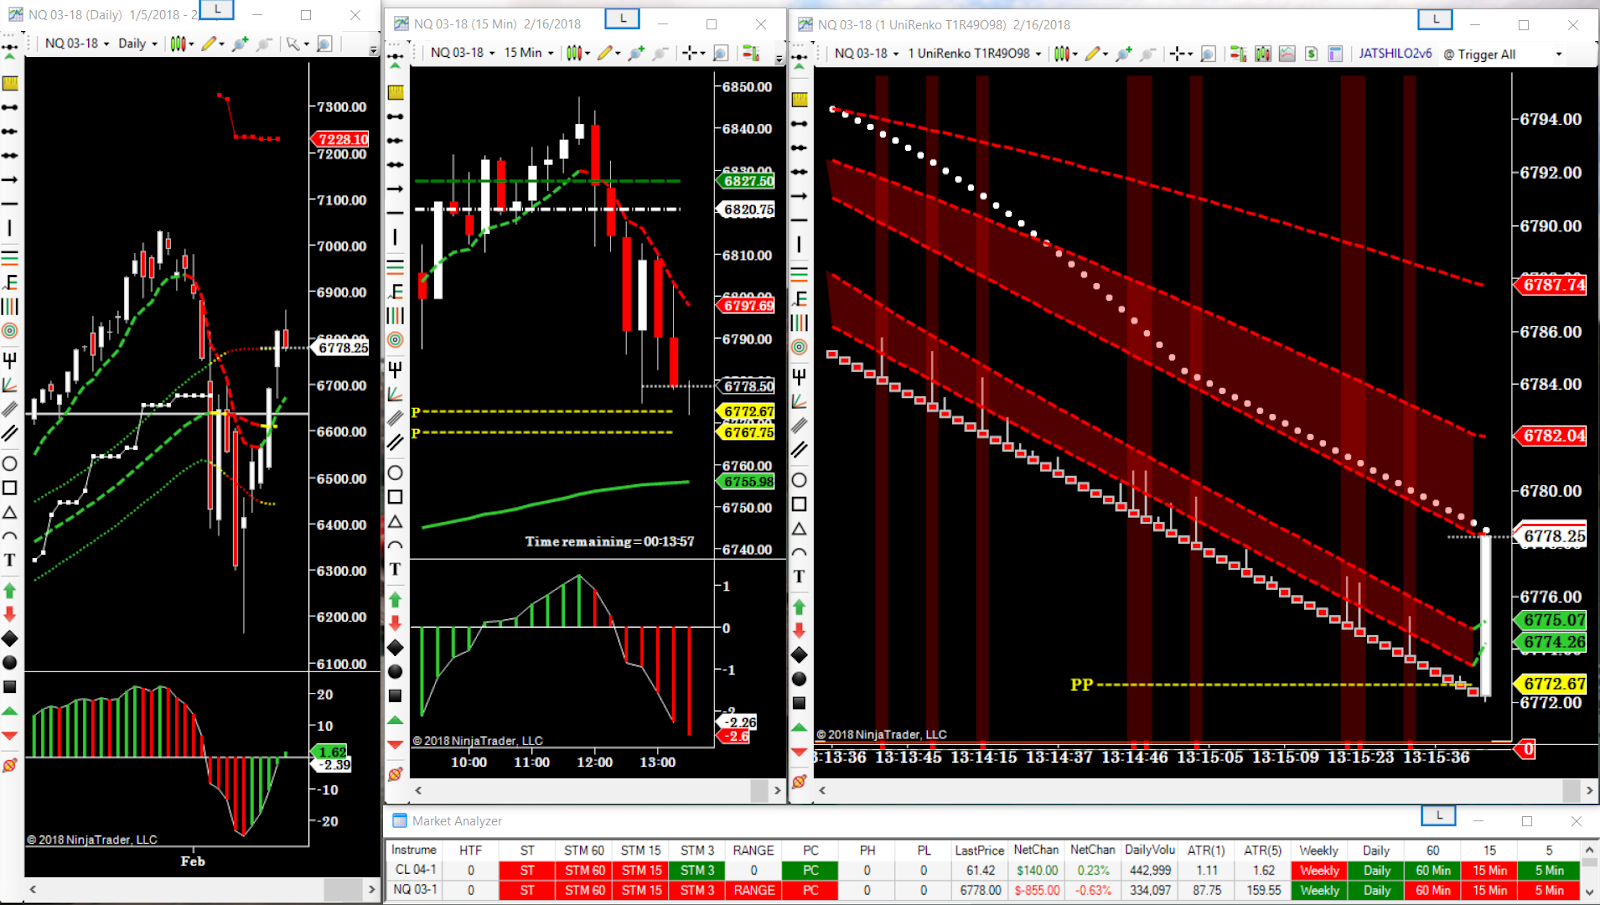
JATS HiLo2 Template, Reversals Top Solver.

JATS HiLo2 Template, HiLo Short Solver.


January 26, Emini - Top of Market?

January 24 - Emini - Key Reversal Day - is this the top of market?

January 3 - Nasdaq - new all time highs off of great ISM Manufacturing PMI numbers.


January 2 - Euro Globex Overnight Session.


November 16 - NQ. Nothing like a little tax reform to get the markets moving.

November 15 - CL. Crude holding Yesterday Low after EIA report showing inventory build. Next OPEC meeting is on Nov. 30.


November 9 - NQ. JATS updated JATSHiLoInflectionsBHv3 Template.


 |
| JATSHiLoInflectinosBH Template - ST Inflections Both Solver |
 |
| JATSHiLoInflectionsBH Template - Reversals Short Solver |


Early session rally. JATSBollingerBandsBHTv2. Trend Long.


August 11 - Crude Premarket.
Coming off a bumpy bottom.

Markets bid overnight: Crude, Gold, Bonds.

July 25 - Copper.
New template in development, same strategy - to seek trend condition and then execute on lower time frame.

New template in development with both a trend condition and then flip the trend solver.


June 22, 2017 - Beans. JATSHiLoInflections template using a 4 Range bar.


June 2, 2017 - Gold. Climbing to 1300?


May 17, 2017, Gold, All that Glittered was Long Today!

May 8 - 12 - NG. Let's get this party started!


May 2 - May 12 - Aussie Dollar. Lower Aussie Dollar for the week. Settled the week off the bottom, toward the mid-region of the move.


May 11 - Ultra Bond. Each tick is $31.25.


May 3- LE. Cattle prices soaring.


April 26 - Aussie Dollar.

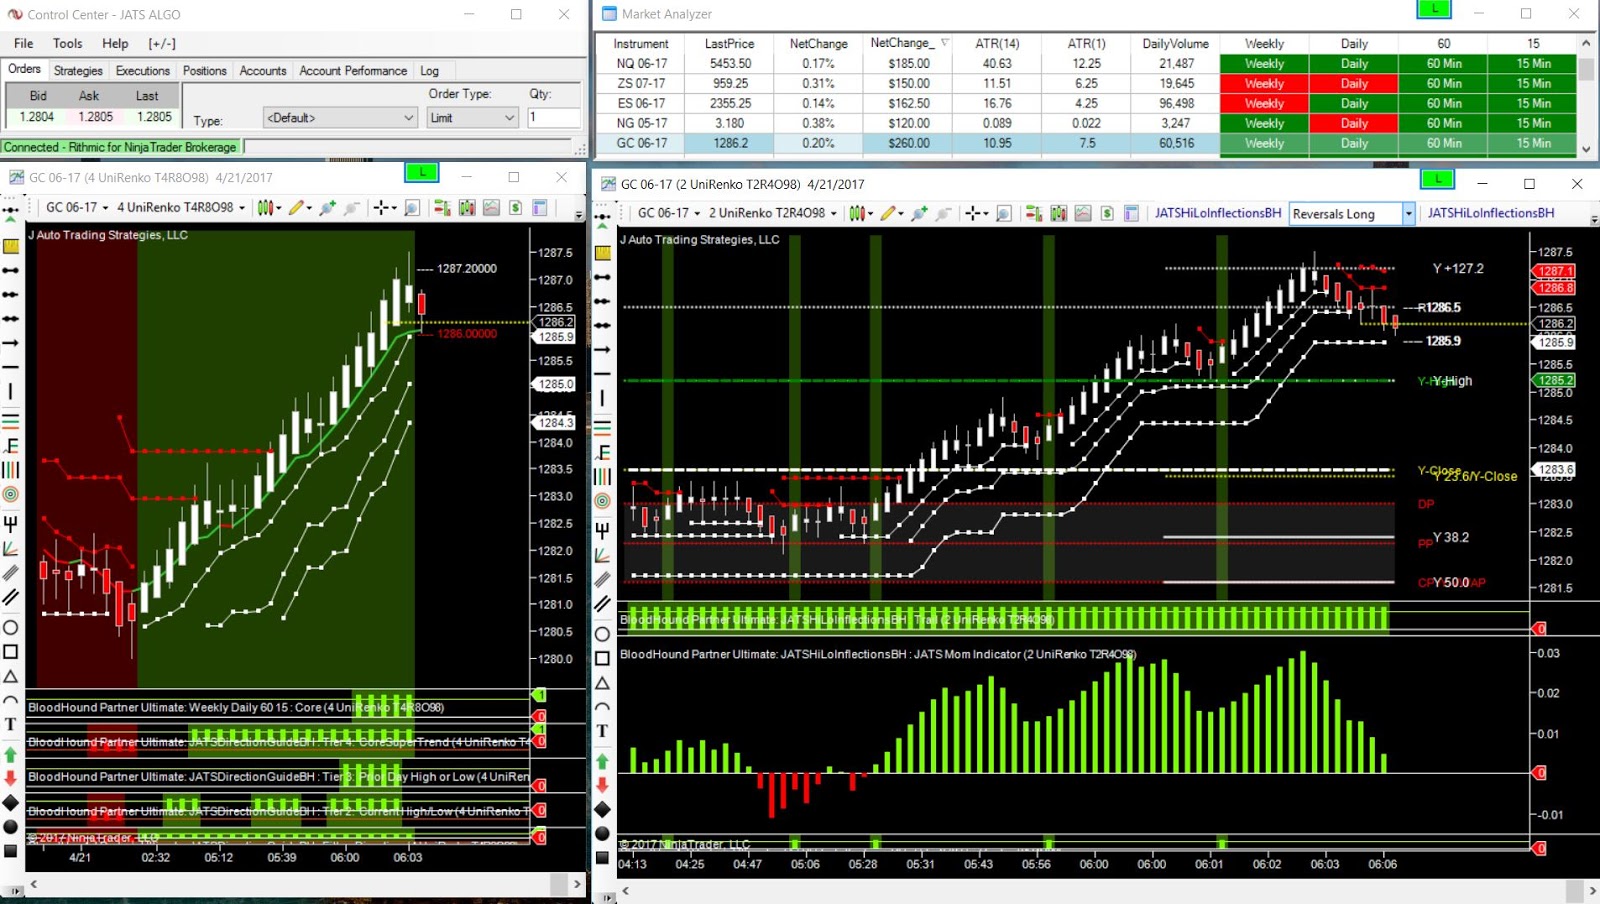
April 21 - Gold Part 2 - Trend Continuation Move after Retracement.


April 10 - Nat Gas - premarket. Nice signals from JATSHiLoInflectionsBH Template, Long Inflections solver.


March 21 - 30 Year Treasury Bond Futures


March 10 - Ultra U.S. Treasury Bonds

March 9 - Crude

March 8 - Crude


February 27 - Algo Testing on GC


 |
| JATSDirectionGuideBH Template with Stochasics Short Trigger |
February 15 - Ultra Bond


February 3 - Emini

All the right moves in all the right places....


Down & Ups in Gas on Friday the 13th.

January 12 & 13 - ES
Emini double-top tapped its high on the 12th.

The final screenshot of 2016 is a short trending condition in the Emini. Short is a view I think we may all have to get used to seeing.

December 16 - ZN
Like Christmas Tree Lights.

Signature moves. Another "Picture Perfect Runup" to the Pivot High.


November 22 Premarket - NQ


November 18 - Aussie Dollar

November 11 - Crude

A mini rally after NFP jobs report.

Crude selling off.

November 2 - ES (E-Mini)
Looks like a short-term reversal back into Weekly Value after the FOMC Statement and Fed Interest Rate Decision. Likely short-term given Presidential election news that seems to be coming out on a daily/hourly basis.

November 1 - ES (E-Mini)
Market weak today despite good numbers overnight and today.


How to trade pullbacks? Set your bars up to fit inside the volatility bands. Or, just get our JATS template.

Dollar rising = Gold falling.
Reversals Solver on JATSHiLoInflectionsBH Template.


NQ RTH Session after the ATT/XFinity merger announcement (1:40 pm Central). Will probably make new highs in the very near future.

October 14 - Gold
Bread & Butter Pullbacks.

It looks like 50 is all we get until a retracement completes? I show 49, 48 or a possible 46?

If I can say I have developed one talent in life, it has got to be signaling pullbacks. Making sure I am hitting the fat pitch. Put these settings in my journal to use again on another big trend day.

There is some research I found today that said Gold sells off right before a rate hike. I would say today validated that theory. Dude, there is no such thing as oversold anymore.

Some ups & downs today in Crude. You can't fight Momentum. So just chill out and wait for Mom and Volatility Bands to align together before even attempting to get in.

So this is how to filter out flags...


What a difference an OPEC Meeting makes! We started the session off in a down trend after the EIA report showed a miss on Gasoline inventories. However, price quickly flipped positive on news that Saudi will cut production. A huge surprise. I expect that crude prices will increase somewhat until the Shale Players get back in the game, which should send prices back down. The only thing we can count on is we will all be paying more to fill up gas in our tanks and crude will be tradeable again.

September 23 - Crude
Crude was sideways during RTH session until the FOMC announcement that banks would not be participating in commodities futures trading any more. A total game changer making energy sector much thinner and more easily volatile if you ask me. Vitol should become the #1 Energy Trader in the World now.


September 20 - Crude
River of Gold bounces -- Yesterday River of Gold Value Area High and Current Period's Value are High. Then bounced to Yesterday Low. Nice. River of Make Me Money.

Another down day as of Lunch Time in Crude.

September 15 - Nasdaq
What more can I say? With trend pullbacks. My specialty!

Volatility is back and the E-Mini is ranging below the sideways range that developed over the past few months. I would hope to get more of the same up until next week's FOMC interest rate decision. At least it is moving.
Once I see the market moving in a direction I want to trade in, I drop down to a lower time frame chart that is following the Super Trend Indicator and select the Entry Short solver.
 |
JATSFutures001 Algorithm - Entry & Entry Short |
This is how you short the E-Mini. You relax, and let the trading template do all the work.

Crude rallied on an inventory draw down in Cushing. This might be coming back down after next week's OPEC meeting when news of an anticipated price freeze does not come into fruition.
Also notice in the second screenshot that the prior week's point of control (W-PPOC) is holding up price from reaching R2. It's amazing when I draw my levels in the morning and then see them line up with the price action. Nice.


A trending condition so green it hurts your eyes to look at the chart. Now this is what I'm talking about!


I put together a solver in about 2 minutes that fades the SuperTrend on a short candle touch condition. BloodHound is so easy to use. Very nice.

I need to see price close above 43.65 on my 5/30 UNRs to make sure price is moving back inside the range. There's a nice divergence so this could well happen. NFP at 7:30 and we will see what happens. If price breaks below the 43.07 Gap, 42.63 is FLOD and then next stop 42. I'm officially "on vacation now" -- so I need to put my charts up and get back to relaxing. See you next week.

Screenshot of how the market closed. Love that Momentum Indicator!!!!! And SuperTrend Breakout!!!! Have a Great 3 Day Holiday Weekend!!!!


Momentum again was to the downside following Wednesday's EIA Report. Support finally came at a prior Daily Gap High and my Daily Volatility Level. Picture perfect pullbacks today. Just taking the pullbacks on the Higher Time Frame UniRenkos, or dialing down a bit for a smaller time frame entry worked well today.
Also, Crude came right down to the Daily SuperTrend and a Prior Daily Gap Low and bounced. Imagine that.


Look what happens when there is 3x more supply on hand than what you expected. Prices fall hard.

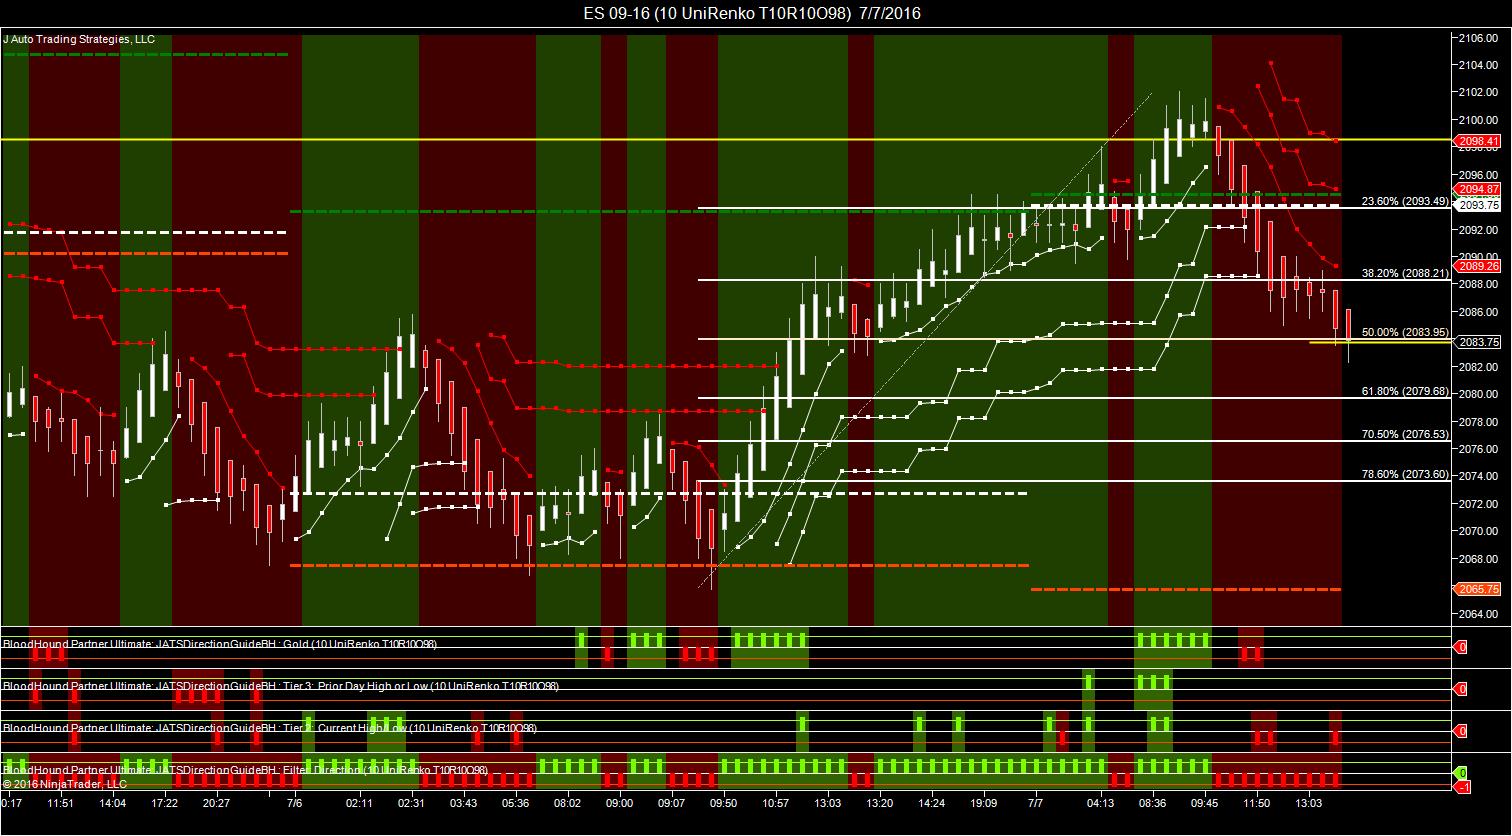
Wash, rinse, repeat on those bread and butter pullbacks today in Nasdaq. Two trending opportunities.
- Step 1, find a market that is trending. NQ trending between 9:00 and 9:30 am; and again between 1:00 and 1:30 pm.
- Step 2, make sure market is trading within volatility levels.
- Step 3, go down to lower time frame and scoop up ticks.
- Step 4, be careful to watch for momentum divergences which will cause a reversion to the mean trade, or a deeper pullback to a prior resistance area.


August 30 - Crude
With trend pullbacks are my bread and butter specialty.

Yellen's speech was like flipping the switch on the markets. The Yen is leading the way down. My only job is to find a good fit for the volatility bands and then set the JATS HiLoInflections Template to Reversals Short.

Could the E-Mini be making the turn?

August 25 - Soybeans
Soybeans had an opening drive short today, and never looked back. So, when the Market Analyzer is red across the board, you can put the JATS trading template on reversals shorts or inflections short, either one, and monitor the HiLo6 Solver on a 3 or 5 minute chart for your stop. Very nice.


Crude dropped lower after EIA report, but ran into a brick wall on the 60 minute volatility level at 46.46 where price bounced and the volatility level held through the pit close.

The market analyzer for Daily, 60 and 15 minute time frames were showing red. So, just set the trading template to either take reversals short, or inflections short, to get the meat out of the middle of the move after pullbacks.


August 17 - Crude
End of the line for Crude? It is 2:01 a.m. Central Time. Crude Daily pressing up on 200 EMA and at the upper volatility level.

August 16 - Euro & Yen
Currencies were in play during Globex. I can't tell you how hard it is as a U.S. Trend Trader to wake up and see the currencies already maxed out at their extremes. Good thing I woke up early and got some trades in!


August 14 - Prior Week Performance


Text Book Multi-Bar Pullbacks.


August 11 - Crude
Scratch that return to value post. It's looking to me like a V Bottom....

Here's a brain teaser. When does Nat Gas rally after an EIA Storage Report miss? When the Panama Canal is widened and a new trade route allows U.S. natural gas to be sold in the Asia markets.

August 11 - Crude
Wash, rinse, repeat. Retrace up to Y-POC and Y-78.6 and fade back into value.

A bullish move for Beans as shown on both the Market Analyzer and price action.
- Market Analyzer shows Bullish and Bearish Markets so I can drill down
- Price action printing with Higher Time Frame Trend
- Price action printing within Volatility Levels on Lower Time Frame Chart


Euro trending down today.


Crude rallied up to Y+200% at a breakout above the One Hour Initial Balance level. This was a nice trade for me with extra position size.


Crude hit prior week Point of Control at 42.14 and stopped on a dime. Guess where the volatility level is sitting? Right on top of the POC at 42.24. Amazing how this works. My guess is price will want to test 41.00 again, but that is speculation on my part. Trade what you see. So, I will be watching to see if price reaches up to 42.50 (prior week VAH) and then fall back to 40.67 and reassess next move.

The market rallied on the NFP number, so good news is good news again in the market. That is until rates are hiked and the market sells off. 2193 could provide a surprise in the market as I show a Weekly volatility level that the algos will surely bounce on.


The NQ rally lasted into the next day. This is what leaving a value area looks like.

More sweet spot trades in Crude's mid-morning rally. The easy part of trading with these trading templates is waiting for price to break out of a volatility range, and if the higher time frame is in agreement, taking the pullback signals. Wash, rinse, repeat. Don't forget you can change the bar size to match the volatility. This way you can visualize on the chart how to stay with a trend, and then how to trade in and out of the trend with the smaller bar size, as in the below example taken between 10:00 am and 10:30 am, Chicago time. (Notice the trade started out with the momentum divergence.)


Ok, the pound moved down to the daily low at 1.3120 and started the retracement back up. The .25 basis point interest rate cut had already been priced into the market and the down move was over in an hour. The retracement up caught my attention.


An early "give-me" set up. I didn't see the trade until I was doing the morning video, so I finished the video and went back and snagged 8 of the last 15 ticks down to the pivot point.

Crude settled higher after the EIA report showed gasoline stocks declined, despite the higher inventory number out of Cushing. You can see how price chopped sideways at the high of the day, no doubt frustrating a lot of traders who were unable to short price off the high. A distribution bar has printed with the high at 41.42 as of 10:30 pm Chicago time as price is returning toward the previous value area.


Crude fell out of bed Monday with a low printing at 39.82 just before the RTH close.
Shorts were the trades to take, all day. The Direction Guide BloodHound Template kept you in the trade, printing continuous lower lows into lunch.

Crude is currently retracing intraday in a strong bear market as seen on the Daily.
The JATSMomentum Indicator signaled the divergence for the intraday retracement. Notice the 41.08 level which shows that price broke above the red volatility band and then this level flipped and acted as support just above Y-Close for the sweet spot bounce just about Noon, Chicago time, giving the pit traders a 50 tick ride into the close.


July 29 - Yen
The Yen has pulled off its overnight highs, but the currency did rally up over 2.3% on BOJ's reluctance to fly the helicopter, just yet. So the only thing resembling a whirlybird were the incredible spikes on my chart.


Something was said about candy and a baby?

July 27 - EIA Report, Crude Oil
Crude sold off hard after the EIA report was released that showed an additional inventory build in Cushing.
I was able to make my daily profit target in less than 15 minutes of trading after the report was released. It's not always like this on report days, so I'm happy to bank profits any time I can on days like these.
The momentum indicator works beautifully to show divergence, meaning pullbacks to a support or resistance area. In this case, volatility levels which held up.


July 26 - Blackbird!
Testing the Blackbird beta, FANTASTIC!!!

July 26 - Crude
Price bounced at the open to make the Gap run.

The 20 tick UNRs printed well within the volatility bands. When HTF trend matched volatility and bar direction, consider entries on LTF chart after pullbacks.


July 18 - Crude
The first volatility level nailed it today on the Direction Guide Template in Crude.

 |
| JATSDirectionGuideBH Template |
ZN broke through support at 132.065 and is driving lower with higher time frame trend and increasing downside mom on the lower time frame chart.


How about this for an opening drive????

Watch out Monday because there is a huge momentum divergence on the daily low retest in Crude on Friday. I would not be surprised to see this returning back into previous value areas.

July 8 - E-Mini S&P 500
Market rallied after Non-Farm Payroll Report.


Market sold off today.
 |
| JATSDirectionGuideBH Template |
 |
| JATSHiLoInflectionsBH Template |
July 5 - E-Mini S&P 500
Nice signals today on the HiLoInflections Template.


 |
| JATSHiLoInflectionsBH Template, Solver: ST Long |
There was a nice pop off the bottom in Crude today on Momentum Divergence, that ran all the way up to Previous Point of Control at 48.78. I would expect a sideways stall from here given the 4th Holiday. Traders have their money.
Have a great Holiday! Happy 240 Independence Day!!!!
 |
| JATSHiLoInflectionsBH Template with Momentum Indicator, Solver: ST |
Long Inflections after EIA Report.
 |
| JATS Market Analyzer |
 | |
|
29 June - CL
Long Inflections before EIA Report was released.

29 June - E-Mini S&P 500
Globex rally up
 |
| JATSHiLoInflections - ST Inflections Long |
June 23 - Crude
Pulling out an older chart to show you the new Tops & Bottoms solver. Notice the second bottom signal with Divergence on the JATS Momentum Indicator.
 |
| JATS T&B Reversals |
The index futures are selling off again after Brexit uncertainty. People must be dumping their shares as the 10 Year note is rallying long.
 |
| RTH session template for ES |
 |
| 10 Year Note RTH Session is looking long |
Crude short rally during Globex.
 |
| JATSHiLoInflectionsBH Template, Solver, Reversals Short |
June 24 - ES
Trade Momentum and Volatility for directional trade opportunities. Find the Higher Time Frame Trend with the Market Analyzer and trade that direction with larger position size.
 | |
|

Gold has settled down like the rest of the markets. What a wild ride on Brexit. Just keep hitting the inflections.
 |
| HiLoST Long |
 |
| JATSHiLoInflections - ST Short |
 |
| And it just keeps going! Love this volatility with a great template! |


June 22 6E
A nice hour long rally to VWAP upper 1 standard deviation band.
 |
| HiLoST Template; Solvers: Reversals Long - 3.5 SuperTrend - HiLo6 |
June 20 ES
The morning session was a nice rally up. Notice how price action broke below the SuperTrend first band, then turned around at each of the next Reversals Long signals? The rally ended at the confluence of the previous week high; R2 level; and Yesterday +161.8 Fibonacci extension. The HiLoInflections Template nailed the signals during the early session.
 |
| JATSHiLoInflectionsBH Tempalte, Solver: Reversals Long
Price action reversed just after 10:30 am Central confirmed with the volatility band break down and the market ended up closing on its low. Once the price pattern shifts, recognize this and go with the new direction order flow as shown by the volatility bands.
|
 | |
|
June 18 NQ
The NASDAQ sold off Friday on Brexit and Microsoft news. The patterns remain the same. Once you see volatility lining up, take the trade on the next change in signal.
 |
| JATSHiLoInflectionsBH Template, Solver: Reversals Short |
If you wait until the condition exists (down trend in volatility) and wait for right opportunities to execute the trade. Patience to wait. Then everything is right.
 |
| JATSHiLoInflectionsBH Template, Solver, Reversals Short |
 |
| JATSHiLoInflectionsBH Template, Solver: Reversals Short |
 |
| JATSHiLoInflectionsBH Template, Solver: Reversals Long |
Gold volatility generally has been staying within boundaries.
 |
| JATSHiLoInflectionsBH Template, Solver: Reversals Long |
 |
| JATSDirectionGuideBH Template, Filter: Direction |
Gold broke the Daily short volatility and is running long providing for several RTH session runs this past week. The 30 minute divergence double top may mean we can expect a deeper pullback to 1271'ish. But overall I would say the market is trading well within intraday volatility levels and has been tradeable.
= Taking directional long signals worked out well once conditions were met. Using larger time frame signals to trade on a smaller time frame chart to fine tune entries.
 |
| JATSDirectionGuideBH Template, Solver: Long Trend |
 | ||
JATSHiLoInflectionsBH Template, Solver Reversals Long
|

 |
JATSHiLoInflectionsBH Template, Solver Reversals Long
|
The futures indexes sold off all day in a nice orderly trend. Notice the narrow VWAP and River of Gold. The blue cloud is the 25% of the Globex value area. The yellow is the 25% of the RTH session value area.
 |
| JATSHiLoInflections, Solver, Reversals Short |
Gold rolled over into a sideways consolidation period. The volatility band levels are working out nicely. In a range, sell high and buy low. That's about all you can do.
 |
| JATSHiLo6 |
Immediately after the shocking NFP report, the highly yield-sensitive Yen printed its largest single-day rally in over a month and ended the week as the second-best performing G10 currency.
 |
| JATSHiLoInflectionsBH Template, Solver; Reversals Long |
June 3, CL
So OPEC production limits were not set following Thursday's meeting. Big yawn on that. The day was capped by the late EIA report following the holiday, and the report showed that Cushing was able to send out some crude thereby lowering the inventories a bit. But the overall theme is every producer for themselves should keep prices sandwiched between 35 and 50 for a long time. Making me scratch my head and wonder where the edge is trading crude. Well, the edge may be switching the Globex and just using the JATS BloodHound Template in an orderly market structure. Looks good to me.
 |
| JATSHiLoInflectionsBH Template: Solver, ST |
 |
| JATS COT Delta Shifts |
Market sitting on Daily Double Top at First Volatility Standard Deviation Level on lower momentum. Looking for reversal.
 |
| JATSHiLoInflectionsBH Template, Solver: Reversals |
Nice up and downs in Gold.


May 22, 2016, Crude
A volatility breakout above 48.50 is what I want to see for a run to $50.00. Seems achievable from here in the short-term time period after the 61.8% bounce on the 15 minute swing high-low fib.


May 18, 2016, Euro
The Euro rocks! Way to move! Traded the HiLo6 all the way down. Actually I didn't. I missed this great trade because I was trading stupid crude.

May 13, 2016, NQ
Keep an eye on Momentum at Double Bottoms. NQ is bouncing at the Globex double bottom on this mom divergence. This looks like a larger retracement is in store after yesterday's huge sell off.
 |
| JATS HiLoInflections Solver |
May 5, 2016, CL
Trading inflections below the River of Gold today in Crude.

May 2, 2016, CL
The market is holding above Last Week's Pivot Point, but breaking below the current pivot. Squished between the pivots is not a good trading zone to be in. Wait for market to set up for best possible trades.


April 18, 2016, CL
The signals will come, just wait for them. Wash, rinse, repeat.


April 14, 2016, CL
W.D. Gann must be rolling over in his grave on this Crude Daily double top in a strong weekly downtrend.

April 12, 2016, CL
Amazing momentum and picture perfect volatility today, just perfect. All the algos were in line. Was that a false news article? Who cares. Talk about a hungry market for some positive vol.
 |
| JATSDG Custom Template, Solver, SuperTrendDG |
April 6, 2016, CL
Is the bottom in?? A "V" bottom on the 20-30-15 UniRenko bars, that could possibly be the start of an inverse Head & Shoulders pattern once the pullback comes in. Will wait to see what happens after EIA report and the anticipated 4.3 million barrel drawdown out of Cushing.

March 31 and April 1, 2016, CL
 |
| River of Gold BH Template, Solver: BDS |
Crude had an up and down day today. Ups in Globex through RTH 1 Hr. IB, then failure and retracement down to Y-Low before the breaks came on at 38.00.
- TST Combine BH Template, Solver: VWAP.

Rally back on.


Sometimes, you receive little gifts of insights into the markets. I received a gift on Friday with a great presentation given by James Savage to the Topstep Trader recruits. He showed his simple range strategy with an emphasis on the daily high/low and a close above or below the linear regression indicator. I put my own spin on this by extending the signal to move with Heiken Ashi candle close and by adding the prior close requirement, and find that the system is very tradeable and I will include this chart as a mainstay in my core strategies for the ES market going forward.
 |
| Jim Savage Range Strategy |
 |
| Jim Savage BH Template, Solver: HA Entry w/Close |
Possible inverse head & shoulders pattern setting up on the 10-Year-Note. Very light resistance ahead and rate hike jaw boning likely in the near term until next Fed meeting. Will be on look out for a possible last gasp high on the E-Mini, and then the turn. It could be a big one. The right shoulder reversal could occur at the previous close/low volume node area shown on the chart at 128'240.
 |
| JATSHiLoInflectionsBH Template, Solver: Exit Trail |
March 24, 2016, Crude and ES
The Globex session got all the moves today in the crude and ES market before the RTH session open outcry; and the remainder of the day was all retracement. Next week should be better. Perhaps our Fed Chairwoman can shed some light on the rate hike announced for April. lol. Have a great Easter Holiday!
 |
| JATSDirectionGuide Template: Solver, Generic Direction Guide |
 |
| JATS HTF Template; Solver JATS 30 |
March 17, 2016, ES
A slow, steady up trend today. On days like this, I should just learn to trust the forward momentum and set an auto strategy to trade it. Read a book and take a walk around the block.

A great up and down in the NQ last week. This screenshot is what you need to imprint in your brain. This is what you want to see when trading long or short. An orderly market. The UniRenko bars are set up to trade the turns when the turns are tradeable.
 |
| JATS Custom Template |
 |
| JATSDirectionGuideBH Template, Solver: Long Direction |
 |
| JATSDirectionGuideBH Template, Solver: Short Direction |
All that glitters was gold again today! Notice how price responds at the River of Gold?
 |
| JATSDirectionGuideBH Template, Filter: Long Direction |
Crude caught a bid on PBOC reserve ratio cut. Rally was softened due to Euro Zone deflation. Could have been much stronger otherwise. Once the trend and direction are in place, trades are taken on lower time frame once market aligns.
 |
| JATSDirectionGuideBH Template, Solver, Energy |
 |
| JATSDirectionGuideBH Template, Filter: Long Direction |
Price retreated from yesterday's rally. The Short Bar Direction solver in the Direction Guide Template is featured in today's screenshots of two different time frames, an 8 tick range and a 16 tick range.


A picture is worth a thousand words. The late day news rally in crude.

 |
| JATS Custom v2, Solver: JATS STRAT |
A two session range broke short on low momentum Friday. I am looking for an uptick in momentum next week as a spate of economic data is to be released. The increased momentum could help get us out of this range and back into some good directional market moves.
A secret for trading ranges can be made with a resting limit order either on the Keltner midband, or at the Value Area High on the MP Lines indicator, shorting price back into the range.
 |
| JATS Custom v1, Solver: JATS C20 |
Or, you can trade the Keltner bands on a small range day and take advantage of the cycle swings.
 |
| JATS Custom v1 Template, Solver: JATS Keltner |
Another "picture-perfect" trend day for the NQ. A very slow and steady trend up that piggy backed off the recent energy market rally, and that momentum was capped off by today's good data reports. You can't ask for any better than this. Price just hugged VWAP's first upper deviation band all day long.
 |
| JATSDirectionGuideBH Template, Filter: Long Direction |
Technology traded in an orderly sell off early into the session, but soon flipped above the River of Gold, then ranging and closing choppy near the daily/weekly highs in what could be the start of a pullback in a very strongly down-trending market. I am looking hard at each rally for a possible reversal location for a trend continuation short trade. I will wait to see some red on the higher time frame Direction Guide Template before taking the trade.


Market flipped above River of Gold today as price ranged between Yesterday Low and S3/Y-161.8.


February 10, 2016, ES
Premarket ranging -- in holding pattern pending Chairwoman Yellen's congressional testimony.

February 8, 2016, NQ
Nice entry signals today with the JATSDirectionGuideBH Short Direction Filter.
 |
| JATSDirectionGuideBH Template: Short Direction Filter |
Trade Plan going forward with Direction Guide Strategy is simple as 1-2-3.
1. Higher Time Frame Trend - trade in direction when all 4 match.


I will have Raven set up next week to take these trades in all the markets: Gold, Euro, ES, NQ, ZN and CL.
February 4, 2016, NQ
The Spoons and NQ ranged today ending near their pivot points. Crude had a small up and outside range, but then it failed and came back to end the session at its pivot point as well. Very confusing market action today. Who sent the memo, let's all park in the middle!


Fed wants to raise rates in weak global macro, and market tanks. Trade plan, short.

January 6, 2016, E-Mini S&P 500
Well, the news is not good from China to Iran. And the markets have spent the last few days selling off big time.
The Direction Guide Strategy has all the moves though. Hitting those shorts when they are in line for the taking with the Market Profile River of Gold. Just wait for the momentum to roll under Zero line and start hitting the retracements. The first came at 12:10 pm CST, which led to a 15 point drop.

December 28, 2015 E-Mini S&P 500
Ode to a Bracketed Market. Price action set up beautifully on the 1 day 70% value area for the E-Mini.
There was a nice 1-2-3 after the open that sent price below the daily developing value area low. BloodHound can be set up to trade these range extensions back into the value area, yielding a nice profit too. This is what Don Jones refers to as day trading the profile. The stochastic crossing 80 or 20 signals the reversal back to the mean or opposite value area. 13 points on this up and down move. 13 x 4 = 52 ticks @ 12.50 = $650.00 of opportunity on 1 contract. There were 10 points up to the value high and then 3 points back down to the middle again. Our job as day traders is to recognize these opportunities and then execute them when they set up. Having BloodHound helps.

If you set up your chart with the Direction Guide strategy, you can take 4 bar fractals with trend. This solver does just that, making pullback trading a snap.

It feels like Friday = probably due to the light holiday volume. There was a late, delayed positive reaction to the GDP print. But the market did close on its high which I'm glad to see, a positive sign in a new bear market. Bear market means love those rallies to sell.
This is a simple solver that looks back at the previous high/low for a set period. It hits the corners really good.

December 21, 2015 E-Mini S&P 500
If you know where price will be….. Then you can make money.
Forget about all the other blah, blah, blah. If you know where price will go to, you have an edge, and an opportunity to make a profitable trade.
In real estate, ask Donald Trump. It is all about location, location, location. In trading, if you ask me, you need to know where the algos are going to. I have been noticing the same patterns at certain levels where algos bounce. One of my favorite trade setups is the classic overbought/oversold with price/momentum divergence. I have a BloodHound Template set up to signal me when price and momentum diverge. I like trading these signals when price leaves the second VWAP deviation band or a value area. This first setup occurred on December 21st around 10:43 am, and then price bounced again just before the RTH session close with another great divergence signal at a convergence level comprised of (1) the developing value area low, (2) the 2nd lower Initial Balance deviation level, and (3) at the prior open. Another great divergence signal to end the day with another great run.

December 18, 2015 E-Mini S&P 500
And the shorts just keep on coming.
I noticed that the Heiken Ashi Doji on the UniRenko can be a good signal at levels based off previous value or at a developing value level. Especially in a market that is moving directionally.

Price closed just at/above/on the 200 EMA and first upper deviation level, and the market provided us with two good runs today. The first run came off the open. The second leg up occurred just before lunch but only after a 45 minute consolidation rectangle.
We will have to see how the Central Bank does trading the E-Mini S&P 500 tomorrow. I will be watching for range extensions beyond 2080 and 2030.


December 11, 2015, E-Mini S&P 500
The RTH session ended on its lows Friday. Like Icahn says, you ain't seen nothing yet. I'm loving these long moves myself. 19 points to start, then another two nice runs of 9 and 15 into the close.


*****************
Today's morning session set up beautifully on the spoons today. I'm thinking I"m going to stop trading crude for a while because it is bottoming out. The spoons probably has much better probabilities for directional movements.


And I even got a few good divergence signals for short reverals today.

December 10, 2015, E-Mini S&P 500
The spoons have become tradeable for me in the RTH session. The Direction Guide BloodHound Template shows the direction to focus on. And the Divergence BloodHound Solver shows some reversals. And the Trigger BloodHound algorithm shows plenty of locations. This practically takes the guess work out of trading!
I have found that having a BloodHound template or two on the chart keeps me disciplined. And that is something I must have trading today.


October 30, 2015, Daily Close in NQ
Waiting for price to leave the value zone after lunch proved to be a profitable trade. And shorting the momentum at pullbacks to the moving averages or at prior value areas were great places to add onto the position.

October 28, 2015, Post EIA Report
As I suspected, Crude bounced up into the yearly value area and rallied up to the composite VWAP at 46.00 before bouncing back towards the previous POC support area at 45.41.

Performance Report for today.

Trading text-book perfect between 30 minute and daily value areas today in the NQ ahead of the FOMC minutes.

The Nasdaq has been rallying this October with the other equity indexes and just broke through a weekly consolidation level into a higher range, settling Friday at around the 4350 level.


If price retests 4400/4450, I would expect a bounce back through the current 4350 area, and I would want to see the 20-day composite POC at 4290 hold the trend. 4250 at the most, which is the 20-day composite VWAP.


I doubt this is a double distribution; however, and I do think price is more likely to fill that air pocket in before continuing in the bear market that should occur once the fed announces the first interest rate hike.
So NASDAQ bulls, keep your eyes on the overhead resistance at 4400 because I think this is coming back down to 4200 in the near future.


September 3, 2015, Thursday Crude Post Market Review
V TOP
Today was a good day of a V Top chart pattern example in crude. Bulkowski says price moves up in a straight-line run then drops almost as quickly as it ascended. The difficulty with V top chart patterns is that by the time you recognize it, the move is over. I trade a lot with the Mom Trend solver on the Direction Guide Template. It helps me stay with a trend. Up or down.

September 1, 2015, Tuesday Crude Post Market Review
Retracement Tuesday

The 12-18-6 UniRenko bar type was perfect today I have to admit. The 12 range/30 reversal bar type showed crude's great ping-pong, flush and spike type of price action.
The 6-9-3 UniRenko bar type allowed closer entries. The inflections when triggered were great locations for an entry.

- 2/3/5 bar inflections at support/resistance, with trend
- Bounces at profile/vwap levels, moving averages
- BloodHound Templates:
- Mom Core Inflections solver from the Direction Guide Template
- Crude/Nat Gas solver from the Direction Guide Template
- Mom Cross Inflections solver from Value Areas Template
Price settled down at the middle of the previous session's range at 45.29.
Tomorrow, Wednesday, is the EIA report. Tuesday's afternoon's API Weekly Crude Oil Stock Report reported an increase of 7.3 million barrels of inventory. If true, that would be a 20 week increase in the inventory builds. Very bearish at a time like this. http://www.api.org/ We can only wait and see how the market reacts to a negative inventory build. The EIA report is estimating only a 0.3 inventory build, which would be bullish overall for crude and may end up support price at the half back? Move it back up for my monthly hammer. Will have to wait and see. Trade the plan.
August 28, 2015, Friday Post Market Review
HIGHER TIME FRAME PARTICIPATION


The intraday moves were equally impressive. A second day in a row of a long range extension opening drive. Today's initially rally between the open and 9:30 am was $2.88. 
Today was a text book perfect example of higher time frame participation pushing crude up 6.5% today. It was the largest one day rally since 2009.
CNBC reports that crude rallied on good US economic growth and low crude supplies in Nigeria. Market Watch reports that Saudi Arabian ground troops entered northern territories in Yemen in a move to counter retaliatory attacks by Yemeni forces on Saudi soil. Baker Hughes reported that only 1 rig was added since the last report. Whatever the reason, crude moved into positive momentum territory and should continue on this path going into early next week ahead of the next EIA report number.
CNBC reports that crude rallied on good US economic growth and low crude supplies in Nigeria. Market Watch reports that Saudi Arabian ground troops entered northern territories in Yemen in a move to counter retaliatory attacks by Yemeni forces on Saudi soil. Baker Hughes reported that only 1 rig was added since the last report. Whatever the reason, crude moved into positive momentum territory and should continue on this path going into early next week ahead of the next EIA report number.
The weekly chart looks decisive with the range of two prior weeks taken out. I can see crude retracing to $50 or $60 from here.


August 23, 2015, Sunday Market Review
MOMENTUM
Calculation
Momentum is calculated as a ratio of today’s price to the price n periods ago:MOMENTUM = CLOSE (i) / CLOSE (i - n) * 100Where:CLOSE (i) — close price of the current bar;CLOSE (i - n) — close price n bars ago.This is a lesson on Momentum and how I use it in my trading strategies. And how using Momentum saved me from shorting crude at the wrong time on Friday.
- The Momentum indicator measures the change of price over a given time span. There are two ways to use Momentum in trading.
1. Trend following. Buy signals occur when the Momentum indicator reaches a low and starts rising. A sell signal occurs when the Momentum indicator reaches peak and turns down. A short-term moving average of the Momentum indicator can help determine when momentum is bottoming or peaking.Application: Extremely high or low momentum values indicate continuation of the current trend. So, when momentum reaches extremely high values and turns down, look for a continuation of trend after the 1st pullback.2. As a leading indicator. Momentum precedes price.
Application: Trade in the direction of Higher Time Frame Trend with Lower Time Frame Momentum for High Probability Trend Trades.
Friday, August 21, 2015 -- New Multi Year Market Lows


Yes, indeed. Friday gave plenty of short inflection signals to trade in crude. But how do I go about narrowing down the entries to find those that will work and find those that should be avoided? Momentum! I trade in the direction of HTF trend and LTF momentum.

Below is a chart with a Momentum indicator solver that signals when a smoothed momentum crosses above or below the Zero line. Then, when you look at the short inflection signals you are receiving, you can filter them compared with lower time frame momentum to arrive at likely ones to trade.
On the chart below, you can see that any short signals that occurred between 8:00 am and 8:47 am were to be ignored because LTF mom was green. It was only until the short signal occurred after 8:50 am were short signals to be considered for a possible entry. And the short signals at this time were the good ones this past Friday.

The remaining short signals between 9:50 to 10:50 am were also to be ignored as Momentum was positive. This shows the amount of buyers trying to step in and keep price above $40. I am looking for a market to trade that has HTF Trend and LTF Momentum moving in the same direction.

These were the short Friday signals. The first was the best after the open, an inflection at the VAL.

This is the final chart from Friday putting the inflection signals back on both sides of the trend.

July 31, 2015, Post Market Review
Sometimes simple inflections off VAL or VAH work great. The Globex session set up beautifully to ride the VAL inflections down on Friday then back up into value after an employment report came out with a large disappointment, causing a steep sell off in the dollar and resulting commodities rally.

Once price settled down after lunch after the employment report news, the value area inflections again came in handy as the crude bear market downtrend continued and additional POC and VAL inflections provided some entries that worked out.

Crude rallied up on the EIA report which showed increased inventory drawdowns. FOMC did not move the market much but down off its highs.
The Directional Guide Strategy Template got in the trade right at the EIA and continued providing long signals until the close. This was a buck-fifty trade opportunity.

July 26, Sunday Review for Crude
$30 crude? I can possibly see a Daily H&S setting up -- if -- price were to return to Daily VAH at $60.31 and price hung around to fill in the huge air pocket between $58.50 and $55.00. Then, price could resume the down trend move and run the length of the head to the neckline, which is currently about $17.25, or down to $30.00. Shaking that magic 8-ball.

The 5 minute chart shows several intraday trade locations.
- Strong Previous low at 47.72
- VAL at 47.98
- Cluster with VWAP/POC and P-VAL at 45.24
- Weak VAH at 48.50
- Weak Previous high at 48.66
- Strong P-POC/P-VAL 48.83-48.95
- Weak previous VAH at 49.38
- Strong naked VPOC at 49.91
- Previous YEARLY low at 47.09
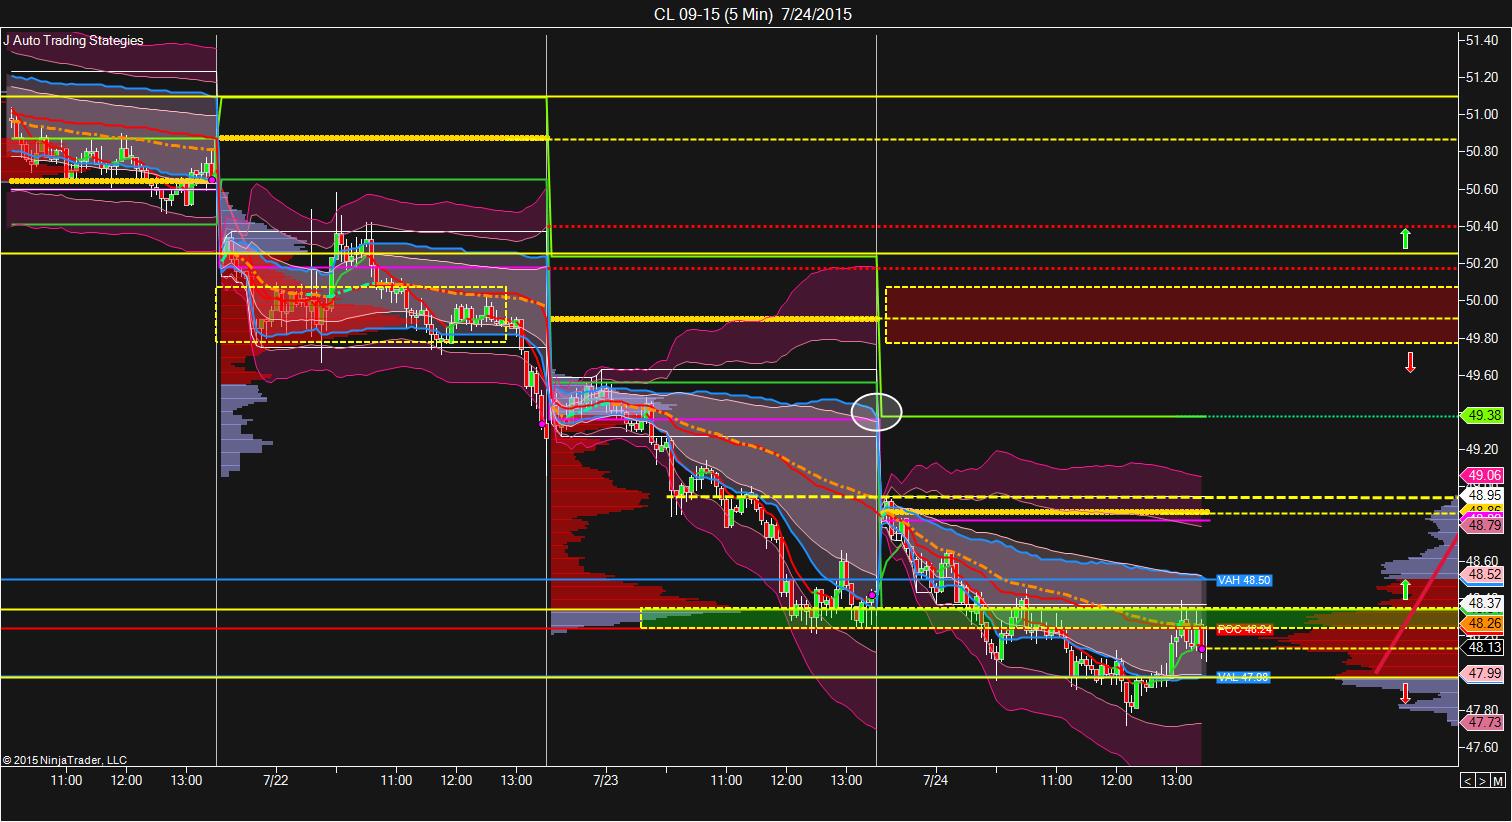
For an upside target, there is a profit opportunity for a trade returning into value with momentum behind it. The N-VPOC at $49.90 has the potential to be a trade target. There would be plenty of room for a move crossing above or inflecting at P-VAL at $47.98.
For a downside target, I am looking for a break of the previous low at $47.72 and a run down to $47.00. And I will watch for a bounce at $47.00 and look for an entry back into value with a one lot and small stop. The market has been ranging. I will wait for a first consolidation confirmation and scale in a second position. If the trade continues to hold up, I will add onto the position again leaving previous VAH after acceptance above P-VAH.
July 22, Mid-Market Analysis for Crude
$50 held price briefly before breaking, where $49.75 became the new line in the sand. Price action ranged inside the 1 hour initial balance primarily between $49.75 and $50.37. Will see if we get a settlement close breakout to the downside.
The direction guide core template for crude held up well during this type of price action. Although I can say it was very scary to get back in to the downside at each top. I think the key is waiting for price to return inside the daily value and then go with the direction guide.

July 22, Premarket Analysis for Crude
$50 was tested again overnight in Globex. The level held for what could be a nice break in today's cash session. If price bounces at around $50.50 and heads back down, there is a very high probability that $50.00 will break today. Where is this going? $47.09 looks like a good guess. A retest of the March 18 low.
It just depends on EIA. I can't imagine enough product shipping out of Cushing to change the fate of crude prices. Get your entry key fingers ready. This is EIA Wednesday and anything can happen.


Price has pushed outside the Yearly profile value areas and is holding on the 78.6% Fibonacci area. I learned about the 70% Fib areas and triangles over the weekend. I must say, I can see how continuation patterns will develop around these levels and/or reversals.

On the smaller 30 minute intraday time frame, price broke out of the triangle but was pushed back down at the half-back of the 7/16-7/17 swing high/low at 51.50. This will be a key level to break for any longs today.
The Sunday swing high/low half-back at 50.92 was tested during Globex and price is bouncing back up toward Friday's settlement.
My chart areas to watch are 51.50 for an upside move and anything below 50.92 for a downside move and continuation of the sell off in crude.
Good luck trading today. Come join me in the Google Hangout BloodHound Users Trade Room where I will be taking trades based on the Directional Guide template.

July 16, Post Market - 30 Min H&S broke neckline - but did not run.
Warning Will Robinson!!! Perhaps my alarm worked this morning because the head and shoulders pattern whimpered past the neckline. We had an inital fakeout breakout between 9:30 and 11:00, but then price reversed back to the downside and broke the neckline for a second time. The right shoulder also looks more like a tiny hump than a shoulder, so I'm wondering if we can expect to see the full $2.38 move down by Friday. If a good downtrend starts tomorrow, I will be looking for $49.24 as profit target #2. Keep in mind that 51 and 50 are being heavily defended by the major institutional traders. It could be a bumpy ride down.


July 16, Pre-Market Review - LOOKING OMINOUS FOR CRUDE
Warning Will Robinson!!! 30 Min H&S looking bad for crude setting up this morning. If price bounces off the 50% support line from previous swing Hi/Lo and comes back to fill yesterday's settlement gap, we are going to be at the neck line and this could tank fast.
Watch 50 because that should be heavily defended by those who have an interest in holding up our #1 asset class.

July 15, Pre-Market Review
Is crude sitting on a new trend up or just clearing stops on yesterday's rally before a downside resumption is continued? One way for me to keep an eye on this is to put up a customized fibonacci of the previous swing that shows me the "value area" of that swing.
The special fib settings are simply 70, 30, and 50. I can see if the market is holding the new trend despite the downward momentum if price stays above 70. If price breaks that line and goes inside the value area from that previous swing, the new trend is suspect. And if price breaks below the 30, the value low of the previous swing, then of course, all bets are off and I am selling.
So far today, crude is still sitting up despite the down momentum. To trade this, I will wait for mom to turn green before entering a long with the Momentum Filter in the JATS Direction Guide Template.


July 10, Post-Market Review
The best way to make good money is to do nothing when price is trading opposite to the daily trade plan. Globex rallied up Friday only to get pushed back down in the cash session in the overall direction of the Weekly/Daily 8 EMAs. There was ample opportunity during this middle part of the HTF down trend to position into a good trade.
I am using the Directional Guide Template for my own day trading and will use this template in the Topstep Trader $150K Combine. Not all the signals will work out. But when I can find the meat of a trend, that is the best shot I have for capturing consistent winners. So when the Weekly, Daily, 60 Min, and 15 Min charts are all trending in the same direction, I will put up the Momentum Filter solver to trade the price action in that direction. And on Friday, the 8 EMAs were all painting red so I was trading short Mom.
The directional move was over by 11:00 am Chicago time, as price started its reversion to the mean trade. The naked VPOC at 51.40 will have to wait until next week to get taken out. There was no urgency in the news to keep price on the low, so a return to the middle of the range was the play.
Next week will be HUGE. So many opportunities once news breaks of the Iran deal. Will this be a buy the news event? We have already been selling the hell out of the rumor. I will just have to wait and see how the EMAs line up next week and take that directional path. It's so nice not to have to wonder about which way to go.

Crude price is coming off the highs and is bouncing off yesterday's POC again. Price could stay flat at the middle of the current range (between Y-High at 53.54 and Y-VWAP at 52.86), until the cash open at 8:00 am. Because price made its way into the middle of the range again, I am thinking Y-Close is in play at 52.59.


Crude hit the upper Naked VPOC and returned to VWAP. The VAL is sitting at Y-Close. This will likely get hit so momentum will be to the downside during the cash session.

I am looking for price to return to the bottom Naked VPOC area at $51.75 due to the current event risk in the market and because of the momentum divergence and low volume node sitting at $52.00 that should attract another price action test of the lower area.

July 9, 2015, Post Market Review for Crude Oil
Crude is consolidating waiting on news from China, Iran and/or Greece. China is interesting because it is making a play for gold. http://tinyurl.com/nwmptge. It's stock market was crashing earlier in the week, so I guess they need to hang onto something of value.
As typical today, price action in Globex ran up nicely and the US cash session ranged. A few good runs were available but you had to be patient and sit out the sideways zig zas.
For tomorrow, a low volume node and naked VPOC are sitting down at 52.00 and 51.60, respectively. This may make for a good target area tomorrow if price expands back down away from the upper value areas.
I am showing the DG1 solver from the BloodHound Directional Guide Template. Gom CD is provided on the chart for visualization and the BloodHound template reflects the cumulative delta tick file.
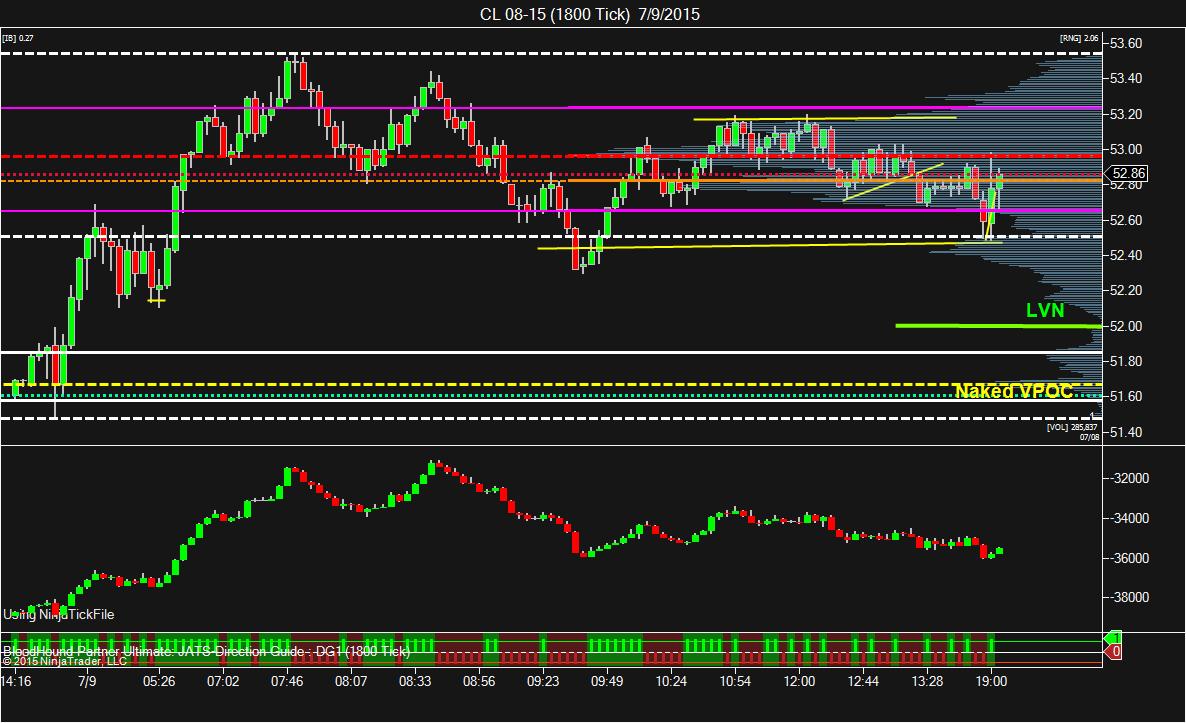
Also a five minute chart showing the 50MomST solver from the Direction Guide Template shows entry inflections on the smaller time frame.

I would like to do something with this cumulative delta chart. I am working on BloodHound templates.

July 3, 2015, Post Market Review for Crude & Discussion of New Direction Guide Template
Crude fell out of bed Friday in a surprise directional down. Crude rallied 10 ticks up off the open, then it was all down hill from there.
My new Directional Guide Trend/Momentum Filter was awesome in providing some great signals for this and I look forward to using this template in the Topstep Trader Combine next week.

July 1, 2015, Pre-Market Review for Crude
Crude rallied yesterday, bouncing off the bottom of the daily pennant pattern. Stochastics are still down, but K is hooking up slightly.
The EIA report comes out today which may provide some directional insight. The API number late yesterday indicates an additional 1.875 million barrels in inventory. This caused crude to come off its highs overnight from yesterday's pit close.
I will be monitoring the JATS Direction Guide template to see where we open relative to yesterday's close and value areas and trade that direction. Currently (7:10 am), price is sitting under Yesterday's Close.


Despite the Globex flush, crude rallied up to the previous value area and closed the gap. Price settled on the previous VAL at around 59.67. The move started at about 10:25 am central with a momentum thrust off the value area low. The move was unexpected. A true short squeeze up.

The divergence signal in the JATS-KXD-1 Strategy Template picked up a nice 5 min divergence signal off the Friday pit session momentum shift up in Crude.

The 60 min bounced nicely off the Yearly Value Area Low. Price is sitting just under the Yearly POC. If support at 59.50 breaks, a retest of this Yearly VAL should be in store in the near future. Should momentum continue on the upside, the Yearly POC at 60.13 or Value Area High at 61.12 would be first and second targets.

June 18-19, 2015, Post Market Review and Look Ahead
Despite the upward slope of the Andrews Pitchfork, stochastic momentum is bearish and on Friday, we got another bearish hollow body Daily Heiken Ashi candle close. Price action has been consolidating inside a range between 58.50 and 62, which can be seen on the dashed green wedge trend lines. I'm going with the shorts given the bearish momentum on an upcoming breakout of the support at 59.37 next week. If buyers step in, I will first be looking to fade 60.32, then look at daily momentum and VPOC shifts for further direction.

Thursday's price action was great trading the MomCross solver when price ran outside value and then flipped back inside value to close on VAH.

June 16, 2015, Pre-Market
Today I am thinking the bulls will end up winners at the end of the day and we will have a higher close given the huge bounce off the 61.8% Fibonacci level from the previous swing high/low.

We are opening above previous value, but must return to that value range to fill yesterday's gap close at 59.55. So, that downside momentum is likely to keep price heading lower in the previous value session until the VAL at around 59.17, which confluences with a support midpivot and the down trend line. I will be watching for a bounce at this area to head back up. I do not want to see price get below 58.83 for my bullish view. So we may see some sideways action inside value, two-way rotational trading, to get price and the POC turned around so the bulls can send this back up.
Should price fail below 58.83 and reach Y-Low, then the fib pattern could fail. I definitely do not want to see price fall below the 61.8% fib line.
========================================================================
June 9, 2015, Pre-Market.
Price is exploring outside value and broke above both previous HOD and through the monthly VWAP, pulling back at the 59.60 level. My trading plan is to go long outside value and discretionary trade the value areas when price pulls back into value. I need to ingrain that into my head and stop trying to fade the tops.


June 8, 2015, Post Market.

- Trading below 20 day value
- 5 Day Trend is Down
- Trading inside 3 day value
- 3 Day Balance is Flat
- Go with breakout of balance as a direction trade below developing VAL
Chart: 3 Day Balance

TRADING DISCLAIMER
We at J Auto Trading Strategies, LLC are not certified traders nor are we certified financial planners. We all chose this profession so that we could take our destiny into our own hands and aspire to a future of independence and satisfaction. We offer NO warranty whatsoever. Execution techniques differ from trader to trader. There is no way to for us to predict any outcome of your trading.
RISK DISCLOSURE
Futures and forex trading have large potential rewards, but also contain substantial risk and is not for every investor. An investor could potentially lose all or more than the initial investment. Risk capital is money that can be lost without jeopardizing ones' financial security or life style. Don’t trade with money you can’t afford to lose. Only risk capital should be used for trading and only those with sufficient risk capital should consider trading.
HYPOTHETICAL PERFORMANCE DISCLOSURE
Hypothetical performance results have many inherent limitations, some of which are described below. No representation is being made that any account will or is likely to achieve profits or losses similar to those shown. In fact, there are frequently sharp differences between hypothetical performance results and the actual results subsequently achieved by any particular trading program. One of the limitations of hypothetical performance results is that they are generally prepared with the benefit of hindsight. In addition, hypothetical trading does not involve financial risk, and no hypothetical trading record can completely account for the impact of financial risk in actual trading. For example, the ability to withstand losses or to adhere to a particular trading program in spite of trading losses are material points which can also adversely affect actual trading results. There are numerous other factors related to the markets in general or to the implementation of any specific trading program which cannot be fully accounted for in the preparation of hypothetical performance results and all of which can adversely affect actual trading results.
WARRANTY AND LIABILITY
J Auto Trading Strategies, LLC ("JATS") does not hold itself out as a Commodity Trading Advisor ("CTA"). Given this representation, all information and material provided by JATS is for educational purposes only and should not be considered specific investment advice. All trades, patterns, charts, systems, etc., discussed in this website and the product materials are for illustrative purposes only and not to be constructed as specific advisory recommendations. By accessing this site's products, services, and information, you accept the foregoing limitations of liability and do not hold Julie Wade or J Auto Trading Strategies,LLC, its officers/employees, assigns, and affiliates accountable for any and all liability. You agree that all products and services provided herein are on an "as is" basis. Julie Wade and J Auto Trading Strategies, LLC expressly disclaim any and all warranties, whether express, oral, implied, statutory or otherwise, of any kind to the users and/or any third party, including any implied warranties of accuracy, timeliness, completeness, merchantability and fitness for a particular purpose.
Copyright © 2019, J Auto Trading Strategies, LLC. All Rights Reserved. No part of this website may be reproduced, stored in a retrieval system or transmitted in any form or by any means, electronic, mechanical, photocopying, recording, scanning or otherwise, except under the terms of the Copyright Designs and Patents Act 1988 or without express written permission of the author.